RivaTuner Guide v2.07-11
Author: Derek Wood
Created: 2 February 2008
Edited: 29 September 2008
Disclaimer: This tutorial was created to help users better understand how to manage an application known as RivaTuner by Alexey Nicolaychuk. I nor Vaguetech and its subsidiaries hold no responsibility for the results caused by using this tutorial. Use at your own risk.
This guide is compatible with RivaTuner versions v2.07 to v2.11.
Reminder: Before doing anything, it’s always a good idea to read the Readme. (Start -> All Programs -> RivaTuner v2.xx -> RivaTuner documentation) Direct Path: “C:\Program Files\RivaTuner v2.xx\Doc\RivaTuner.chm”
Change the “xx” to your Rivatuner version.
- Installing RivaTuner
- Configuring RivaTuner
- Creating Fan Profiles
- Creating Launcher Items
- Creating Scheduler Tasks
- Using Hardware Monitoring Tool
- Using the Statistics Server
- Advanced Automatic Fan Control
- Creating Overclocking Profiles
- Adding Plugins
Installing RivaTuner
The first step of the tutorial would be to download and install RivaTuner.
(this portion of the tutorial is still in development)
Configuring RivaTuner
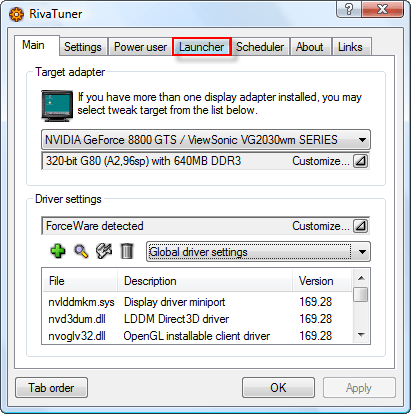
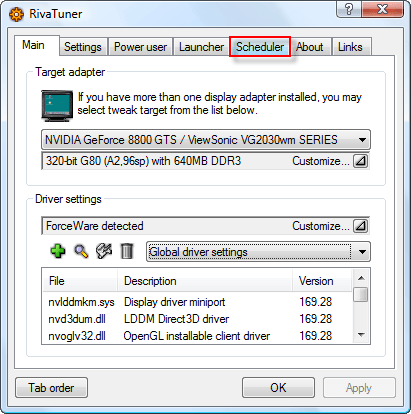
This is how RivaTuner will look after you’ve finished the installing and building of the database.
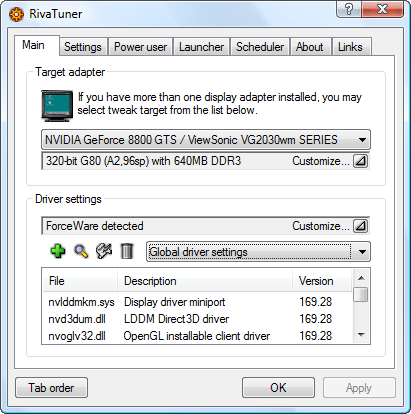
One of the many features of RivaTuner that most people will not find in Vista is the built-in context sensitive help that it provides. There is a patch for Vista which can be downloaded to fix this.
(this portion of the tutorial is still in development)
Creating Fan Profiles (driver method)
This method has been tested and verified under Windows Vista in an SLI configuration.
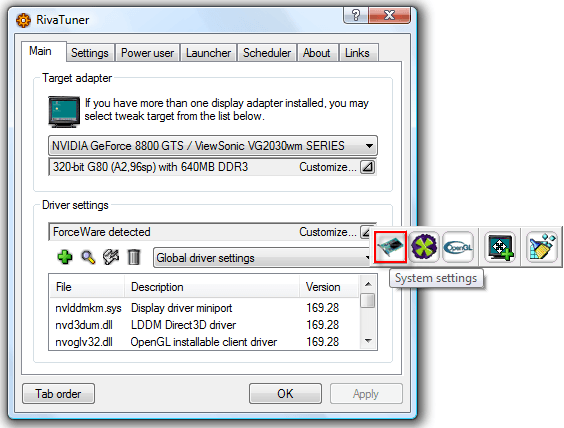
To begin, click the arrow next to the “Customize…” text underneath the driver settings selection. This will drop down a menu of various options. First being “System settings”, which is where we will configure our fan profiles. Click the icon on the far left that resembles a graphics card.
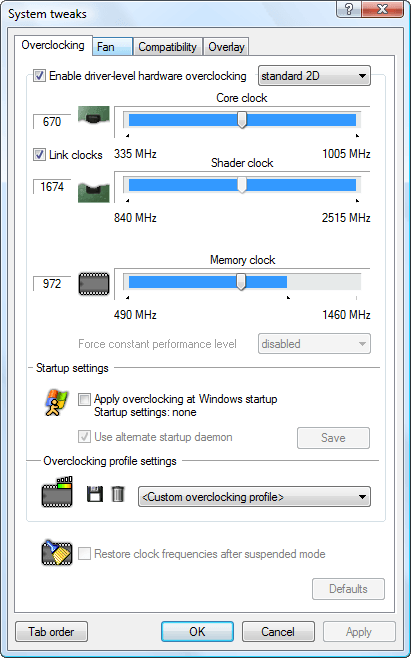
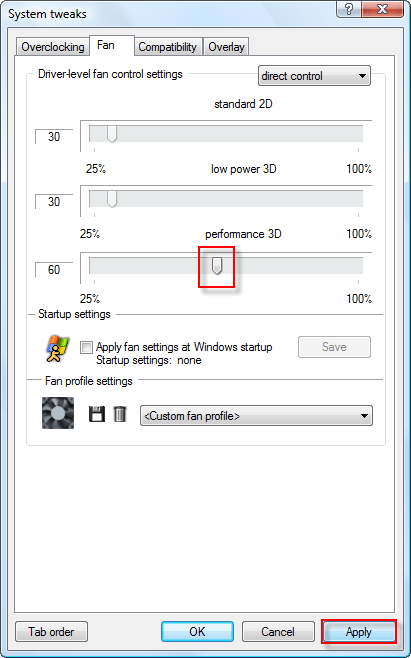
The System tweaks window which allows controlling various aspects of the video cards through the driver software.
Select the Fan tab at the top of the window.
Begin by selecting “direct control” in the drop down box on the top left of the window.
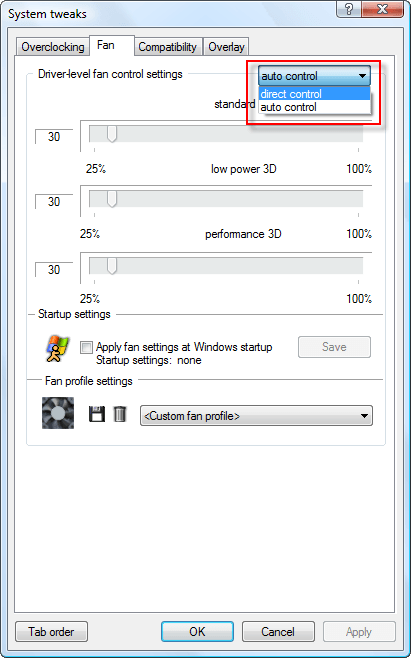
Drag the arrow on the bar to the desired speed. For this picture, 60% duty cycle has been selected.
After you’ve chosen your speed, click Apply. You should be able to hear the fan get louder (most likely at a higher duty cycle).
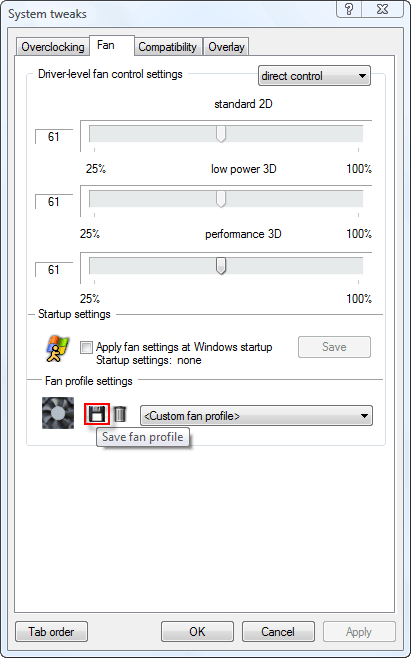
Now, that you’ve set a fan speed and applied it, you can save this fan speed as a Fan Profile.
Click the disk icon to the right of the fan image to Save.
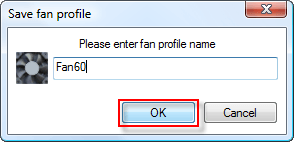
You will be prompted to name your fan profile. For this picture, “Fan60” has been entered.
Type in the desired name and click OK.
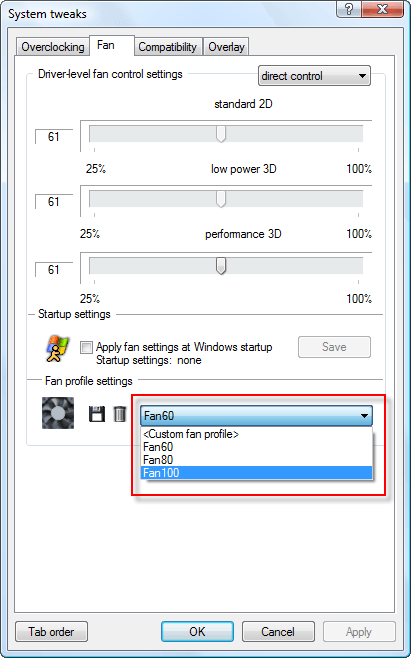
Congratulations, you’ve created your first fan profile. Now, repeat the procedure to create a few more fan profiles.
For this tutorial, Fan Speed 80% and Fan Speed 100% have been applied and saved as fan profiles.
In previous tutorials this method of creating fan profiles was done using low-level system tweaks. This tutorial has used this method, since it supports fan speed control under Vista with SLI builds.
This concludes the “Creating Fan Profiles” section of the tutorial.
Creating Launcher Items
The next part of the tutorial is creating Launcher items. Launcher items are used internally by RivaTuner as well as creating convenient options in the system tray for RivaTuner.
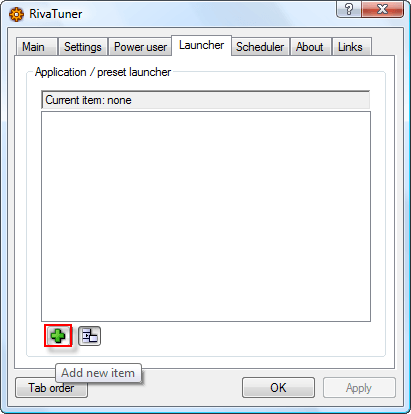
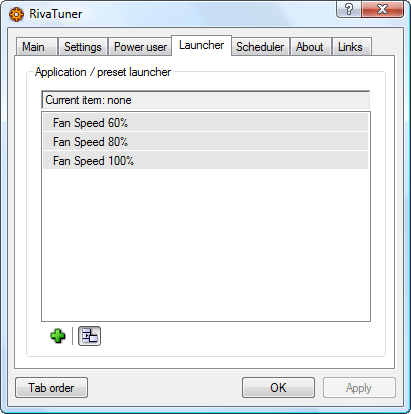
Select the Launcher tab at the top of the RivaTuner main window.
Click the “Add new item” button. (plus icon)
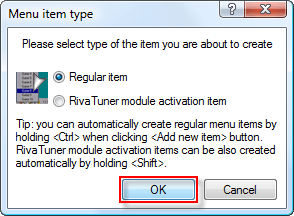
Select the “Regular item” (radio button) option and click OK.
Type in the name of the launcher item for the first fan profile. In this tutorial, “Fan Speed 60%”, “Fan Speed 80%”, and “Fan Speed 100%” have been used.
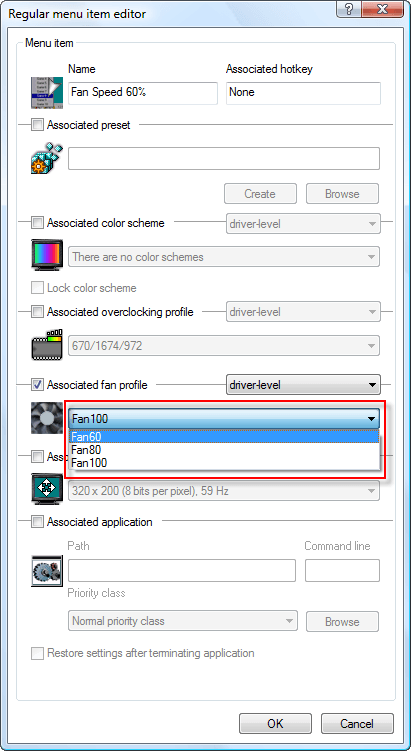
Next, check the “***ociated fan profile” check box, above the fan image. Then the “driver-level” option from the drop down box to the right (if you have no low-level fan profiles, this should select automatically.
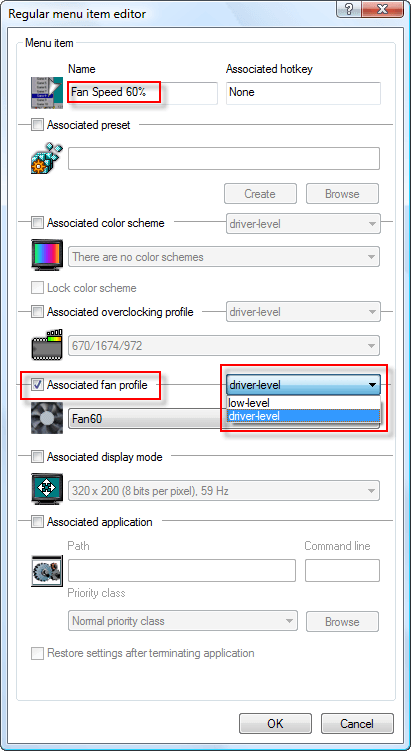
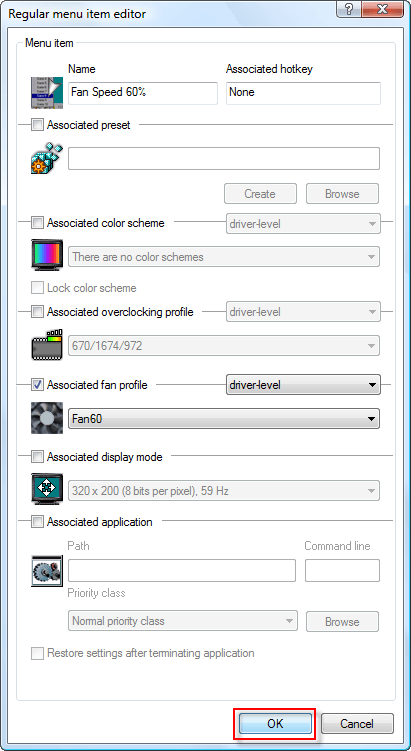
Select the fan profile. “Fan60”
Then click OK.
Now, repeat the last few steps to create launcher items for each of your fan profiles.
This concludes the “Creating Launcher Items” section of the tutorial.
Creating Scheduler Tasks
One of the new features in RivaTuner v2.07 is creating Scheduler tasks. These tasks will trigger launcher items or various applications when an event is triggered. This makes configuring automatic fan speed control very easy along with configuring start-up fan speeds, shutdown thresholds, and other neat tasks.
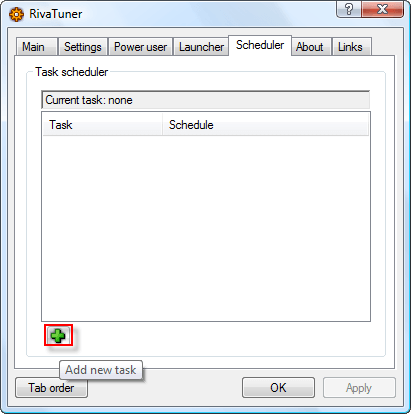
Select the Scheduler tab at the top of the RivaTuner main window.
Click the “Add new task” button. (plus icon)
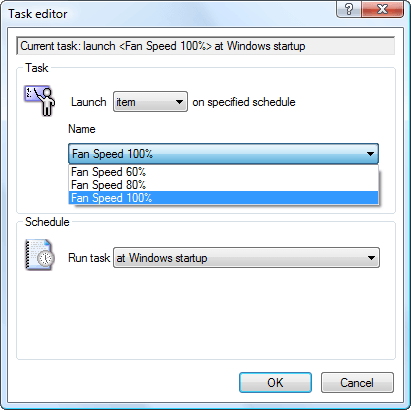
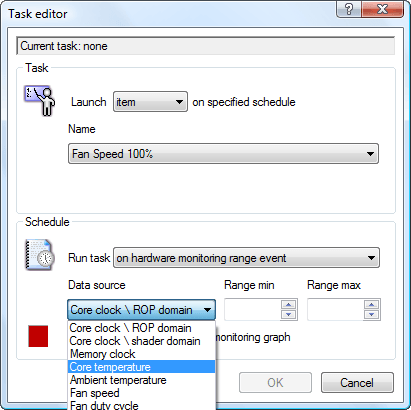
Click the drop down box under Name and select the launcher item for the highest fan profile. “Fan Speed 100%”
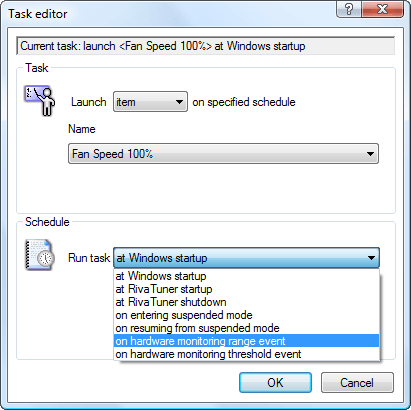
Click the Run task drop down box and select the “on hardware monitoring range event.” This will keep the fan speed throughout the entire selected range.
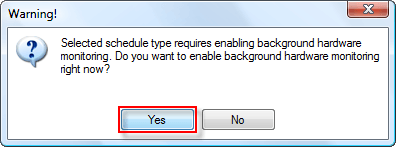
If you haven’t enabled “background hardware monitoring,” you will be prompted to do so after selecting the task.
Click Yes.
Select the drop down box under “Data source” and select “Core temperature.”
If you have more that one graphics card, you will have “Core temperature 0” and “Core temperature 1.” At this time I would recommend configuring for the “Core temperature 0” as most operations will involve just that card.
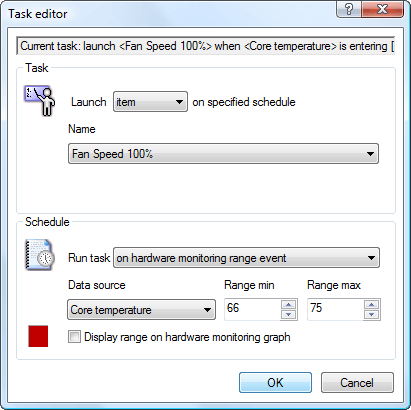
Now enter your desired minimum and maximum temperatures for this fan speed. For this tutorial (66 – 75 has been selected for “Fan Speed 100% launcher item)
The “Display range on hardware monitoring graph” has been unchecked to remove the block of color on the hardware monitoring graph.
As of RivaTuner v2.09, you can create names for these scheduled tasks or if you click “Ok” without typing in a name it will create one for you.
Click OK when finished.
Repeat for the next lowest fan speed (56-65 with “Fan Speed 80%”)

Repeat again (46-55 with “Fan Speed 60%”)
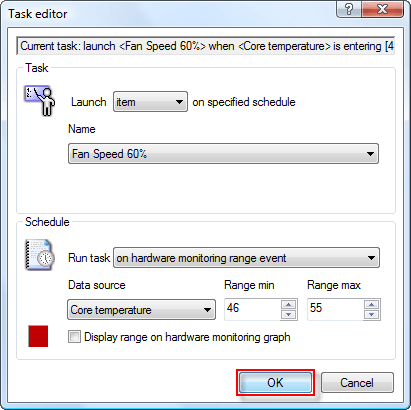
Continue until you’ve created all the ranged events you want.
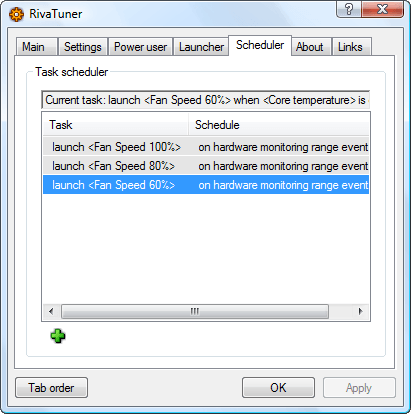
If you run into an issue where the fan speed is constantly changing between 60% and 80%. Then create a gap in the temperature range event. For example: Instead of 56-65 and 66-75 for fan speed 80% and 100%, use 56-63 and 68-75.
This concludes the basics of creating scheduler tasks. The section will continue for additional examples.
Creating a shutdown threshold is important for your video cards. You don’t want to damage your equipment and with this scheduled task you can do just that.
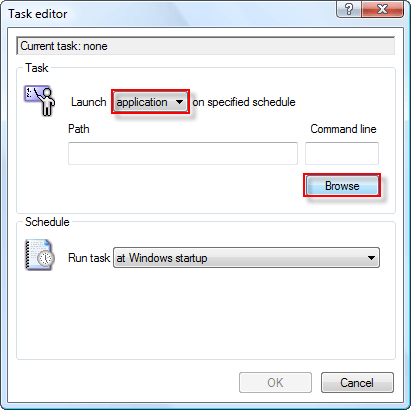
Begin by adding a scheduled task.
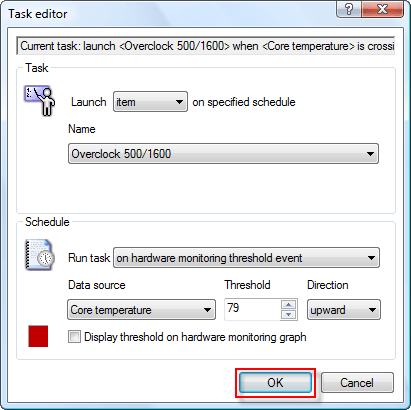
Click the drop down box next to the “Launch” text and select “application.”
Then click “Browse.”
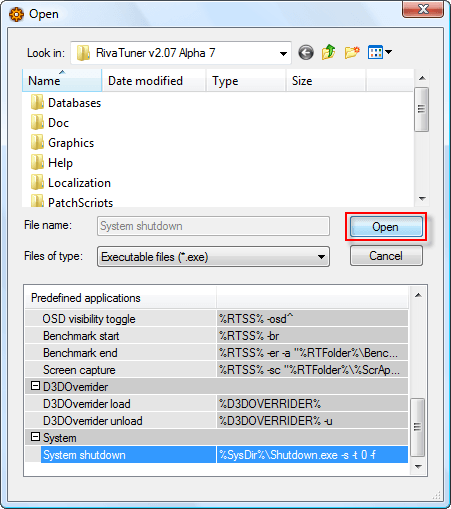
Scroll down to the bottom on the “Predefined applications” list and select “System shutdown.”
Click “Open.”
There are many various options you can use with the Shutdown.exe application. For more information just open a command prompt (Start -> run -> “cmd”) and type “shutdown /?”
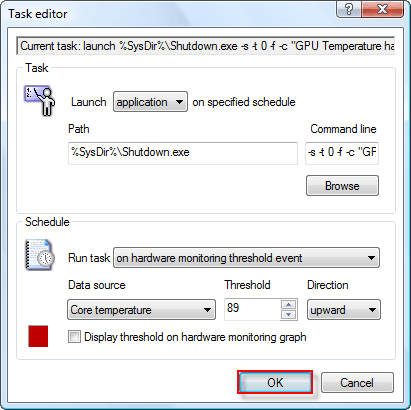
For this tutorial, the command line options are:
-s -t 0 -f -c “GPU Temperature has exceeded maximum threshold. The computer will now shutdown.”
Select the task “on hardware monitoring threshold event.”
Select “Core temperature” for the data source, set the threshold to “89”, and set the direction to “upward.”
This will shutdown the system immediately and give a prompt with the description that the GPU threshold has been reached. By setting the threshold to 89, the event will be triggered when the temperature hits 90.
You will have to do this for Core temperature 0 and Core temperature 1 if using multiple video cards.
You can also configure overclock profiles to start with RivaTuner.
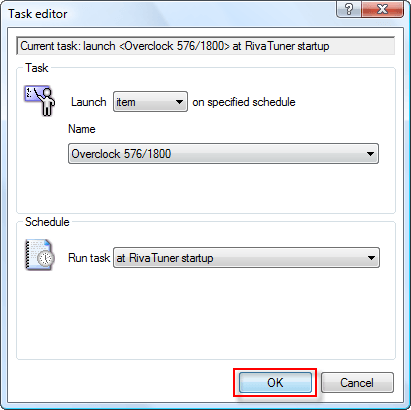
Along with under clocking or restoring the overclock profile when it gets to hot.
Some examples:
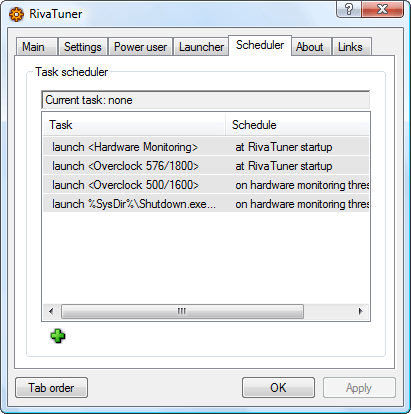
This concludes the “Creating Scheduler tasks” section of the tutorial.
Using Hardware Monitoring Tool
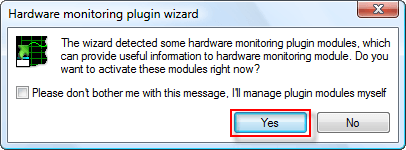
One of the features you’ll be using most in RivaTuner is the Hardware Monitoring tool, which shows various information about computer hardware. Specifically video card hardware with the appropriate plugins.
On first launch of the Hardware Monitoring Tool, you might be prompted to activate some plugins.
Click Yes.
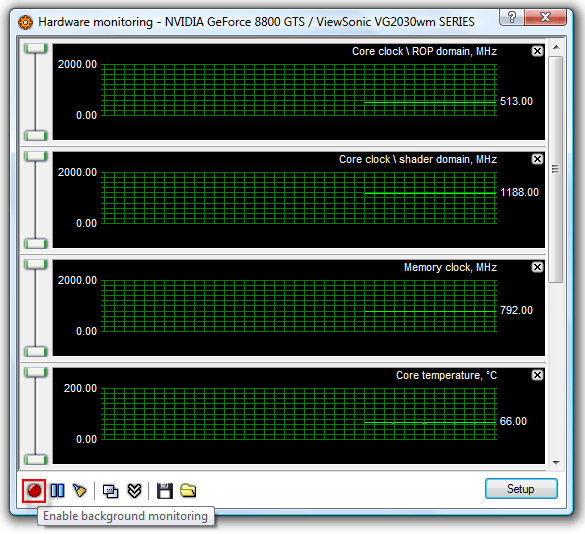
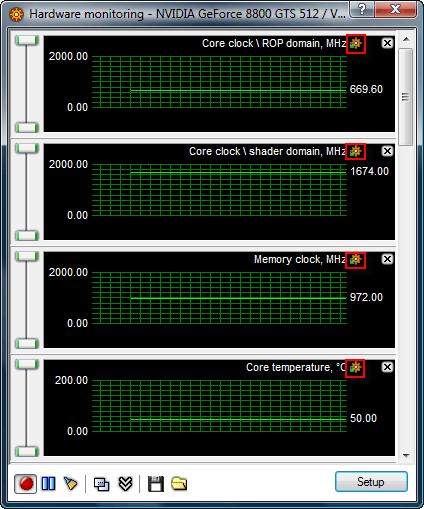
The “Hardware monitoring” window.
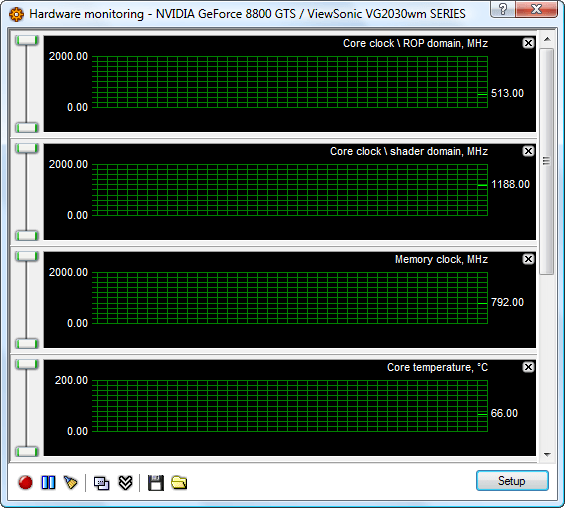
Make sure to “Enable background monitoring” by selecting the red circle (record icon) at the bottom left of the window.
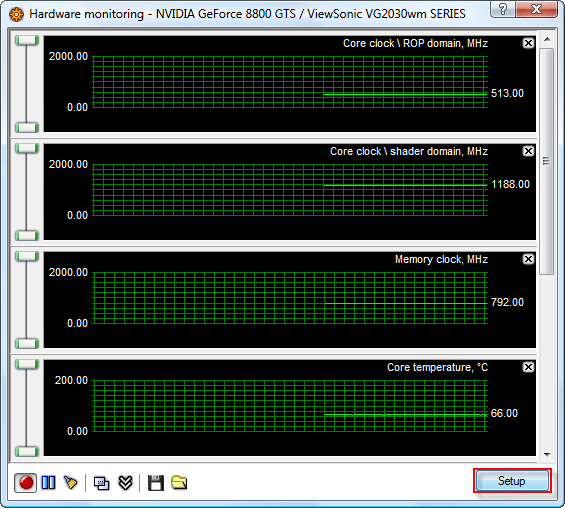
After you’ve done that, let’s take a look at the Setup for the Hardware monitoring.
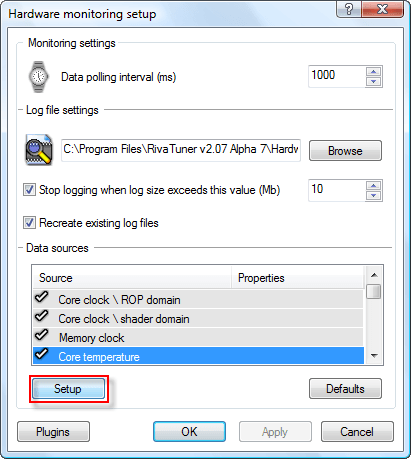
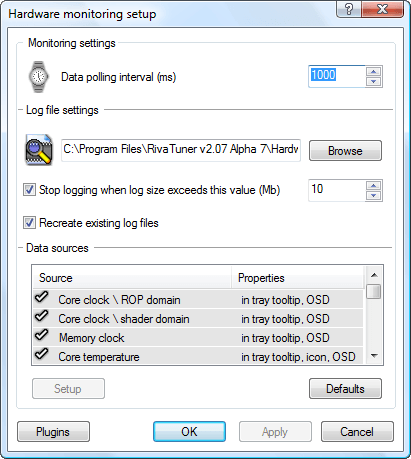
The “Hardware monitoring setup” window has options for everything. Configuring each individual entry to display information on screen, in system tray, or even on your Logitech G15 gaming keyboard.
Begin, by selecting the “Core temperature” under the Data sources portion of the setup (Select “Core temperature 0” or “Core temperature 1” for multi-gpu configurations).
Then select “Setup”
These are the options available for just that entry. To display the “Core temperature” in your system tray and the system tray tool tip, check both check boxes on the bottom of the window.
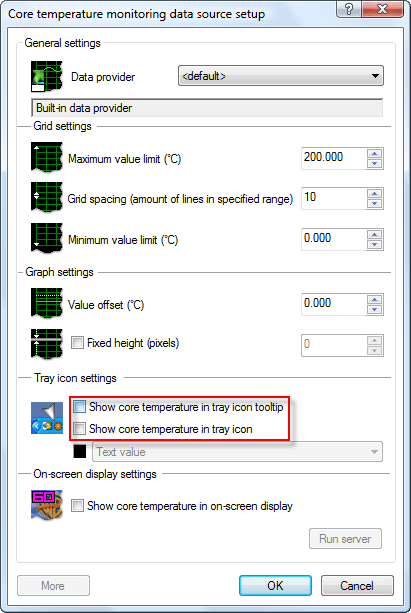
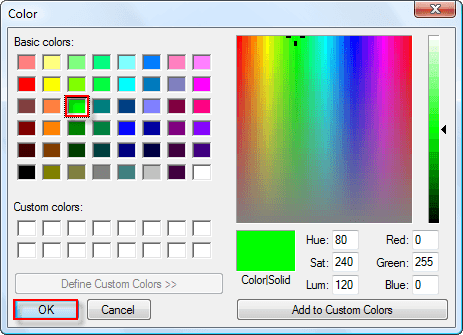
Next, you can change the color of the temperature. Click the black colored box next to the “Text value” drop down box.
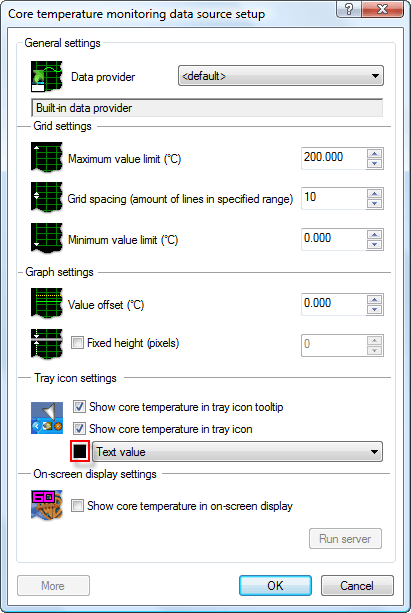
Green is the main color for NVIDIA which is why it has been chosen in this tutorial.
Choose the color you want, then click OK.
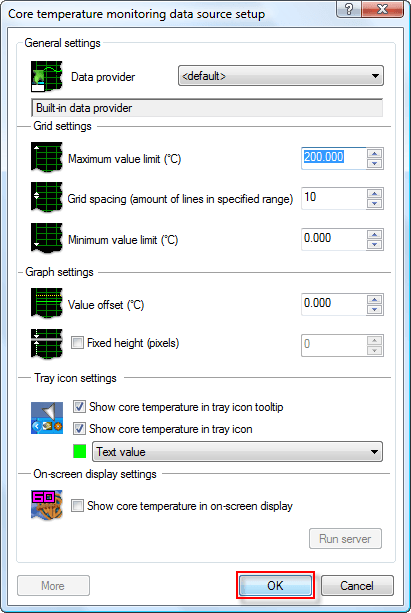
You can also change the minimum and maximum temperature values here and since 200 is a bit extreme, you may want to lower it to 100.
When you’ve finished, click OK.
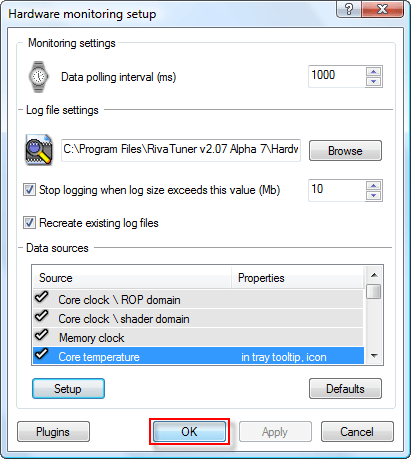
You can browse through the various data sources and enable for tool tip or tray icon.
When you ready, click OK.
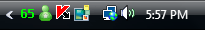
This is an example of how a core temperature system tray icon will look. It’s the 65 on the far left.
In addition to configuring tool tips and system tray icons, you can configure the data sources under hardware monitoring to show up on your Logitech G15 gaming keyboard or on your screen during game play.
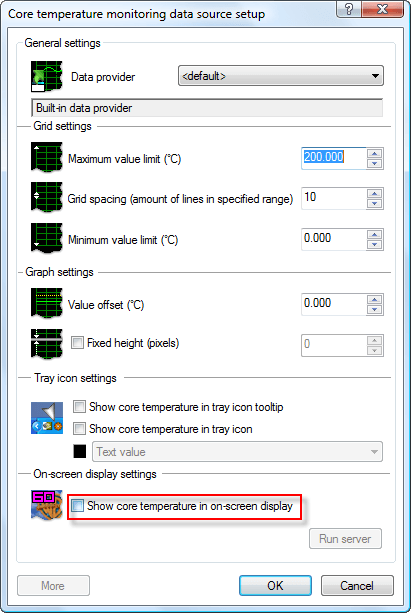
Browse to the data source you want to configure and click Setup.
Then under the setup window for that data source, check the “Show core temperature in on-screen display.”
Then click OK.
In RivaTuner v2.09, you now have the option to edit the group name that the data source falls under. In previous versions of RivaTuner, if you were to have too many entries under one group name, it would be cut off on the LCD display. This allows you more control and organization over your OSD and G15 LCD display.
You should notice the entry on your display right away.
Continue editing the data sources the way you desire and it should eventually look something like the following:
Example of the on-screen display for the Logitech G15 gaming keyboard using an 8800 GTS and the CoreTemp plugin (discussed later in this tutorial).
Using the Statistics Server
Let’s say for example you want to run a overclock profile or fan profile when a game is launched and then revert back to the original setting when it’s closed.
This can be achieved using the RTSS (RivaTuner Statistics Server).
To begin, let’s launch the application. Go to start, then All Programs, then select RivaTuner, and finally click RivaTuner Statistics Server.
(Direct path: “C:\Program Files\RivaTuner v2.0x\Tools\RivaTunerStatisticsServer\RivaTunerSta tisticsServer.exe” – change the x to your version)
In addition to starting up RTSS from the Start Menu, there is also a simpler way. By using the “Hardware monitoring” tool, if RTSS is not running a little icon will show up in the top right of each graph, allowing you to launch it from there. (You can also create launcher items to launch the application from RivaTuner’s presets)
The application will start minimized, but if you would like to check it out. Right-Click on the icon in the system tray and click “Setup”.
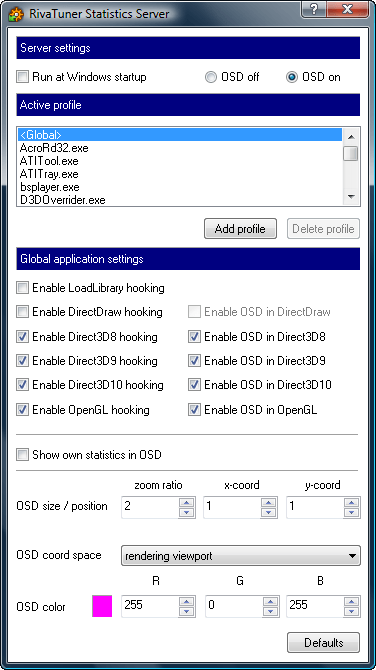
There are a few options here that you can change by personal preference. First is the OSD (On-Screen Display), which when “On” will show various information which you’ve enabled on the screen during a game. [See Setting up the G15 Display for more information]
Also, if you don’t like RivaTuner’s default pink color for the OSD, you can change it by clicking on the colored box. When finished, close RTSS.
After you have closed/minimized the RTSS. Let’s proceed to enable monitoring “Hardware acceleration” in RivaTuner’s “Hardware Monitoring” Tool.
Open up Hardware Monitoring, then click Setup in the bottom left. Scroll down until you find “Hardware acceleration” and click the check box to enable it. You can also enable individual modes to monitor, but “Hardware acceleration” by itself monitors them all.
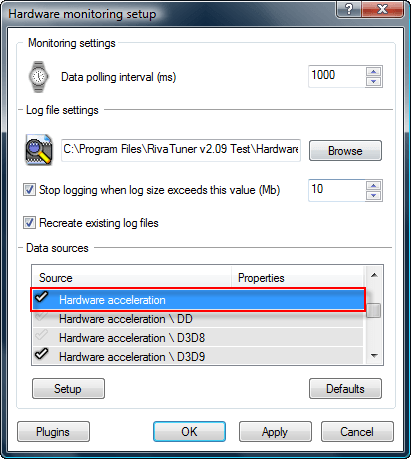
Now, you are monitoring “Hardware acceleration” and any 3D application that it launched or is running will cause the value to be “1.0”. (By default <Global> monitors: Direct3D8, Direct3D9, Direct3D10, and OpenGL)
Ok, now onto creating a scheduled task to start an item or application when the hardware acceleration is enabled.
So, navigate to the Scheduler tab, then click the “Add new task” plus icon towards the bottom left.
Now, (if using RivaTuner v2.09, you can add a custom name) type in the name of the scheduled task.
Select the item you wish to launch. (Example: higher fan speed profile or overclock profile)
Select the drop down box to run the task “on hardware monitoring threshold event”, select the drop down box for the data source to “Hardware acceleration”, set the threshold to 0.5 or something between 0.00 and 1.00, and then select Direction to upward.
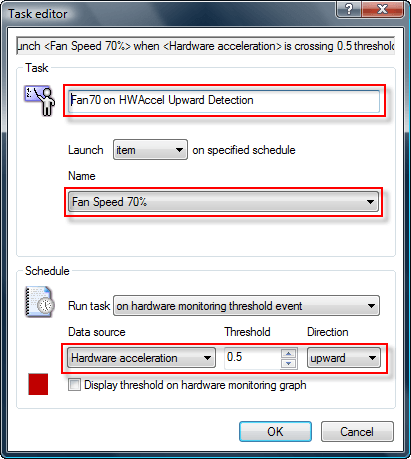
Click “OK”
Now, you will need to repeat the process if you wish to revert back to previous settings when the application is closed.
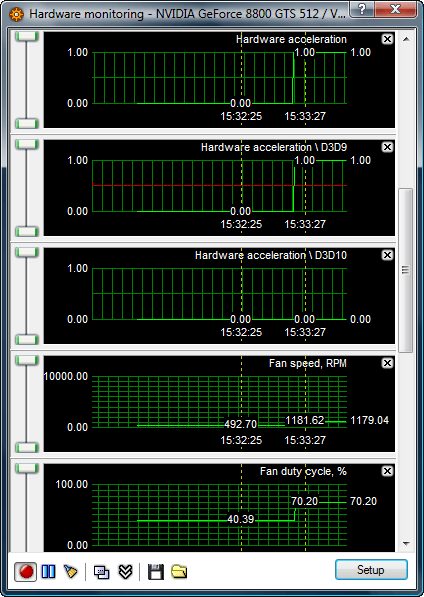
After you have created the downward direction scheduled task. You can test it out.
Go ahead and launch a game like Solitaire and watch your Hardware acceleration increase to “1” and the item you selected launch.
After you’ve tested out your application. It would be a good idea to configure RTSS to launch when RivaTuner starts up.
(This section of the tutorial is still in development)
Thank you for using the “Using the Statistics Server” portion of my tutorial.
Advanced Automatic Fan Control
There is more than one way to configure automatic fan speed. The first method is simple, the second is a little more advanced. The first method supports multiple video cards where this method does not.
We will be tweaking the low-level fan control and in order to do that, we have to set the AutomaticFanSpeedControl value under RivaTuner \ Fan of the Power user tab to “3”.
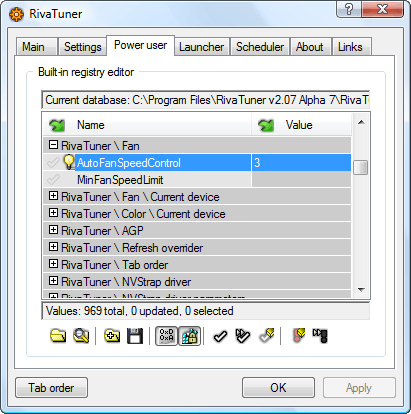
Restart RivaTuner.
Then proceed to the low-level system tweaks window.
Make sure “Enable low-level fan control” is enabled and set to “Auto”.
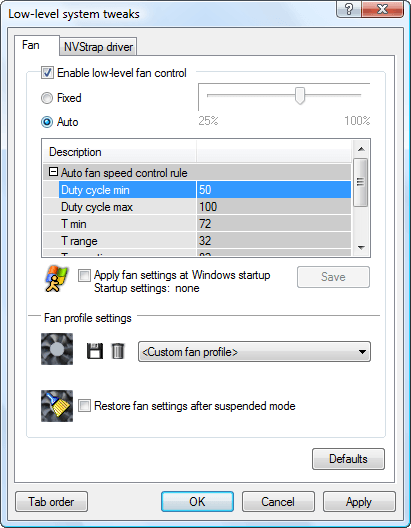
When looking at the 8800 GTS 640MB automatic fan control, these are the default entries.
Defaults:
Duty cycle min: 50
Duty cycle max: 100
T min: 72
T range: 32
T operating: 82
T low limit: 72
T high limit: 92
Now, we will adjust these entries to suit our needs, but first the variables must be explained.
- Duty cycle min: minimum speed for the fan
- Duty cycle max: maximum speed for the fan
- T min: the temperature at which the fan turns on
- T range: the fan duty cycle vs. temperature slope
- T operating: (dynamic Tmin control)
- T low limit: (dynamic Tmin control) temperature that fan will run at min
- T high limit: (dynamic Tmin control) temperature that fan will run at max
To edit a value, select it and press enter.
Set the duty cycles to the lowest and highest fan speeds. Then set the minimum temperature by taking the value you want and removing Toffset [Tmin = Tmin – Toffset].
To determine your TOffset, right-click on the “Core temperature” in Hardware monitoring and choose “Setup”. Then switch between the ADT7473.dll and the NVThermalDiode.dll. The difference is the Offset.
Now, the most difficult part about ***igning the new values, is figuring out the Trange. This can be done by using the formula:
[Trange = 2/3 * (Tmax – Tmin) / (Dmax – Dmin)]
Next, you will want to disable the dynamic Tmin control and to do this just put in temperatures that your card will never reach for the T operating and the T high limit and put in 0 for the T low limit.
Known Offsets:
8800GTS 640MB = 6
8800GT/GTS 512MB = 8
For my card (8800 GTS 640MB), I’ve used a Toffset of 6, range from 55 to 75, and fan duty cycle from 60 to 100.
Tmin = 55 – 6
Trange = 2/3 * (75 – 55) / (1 – 0.6)
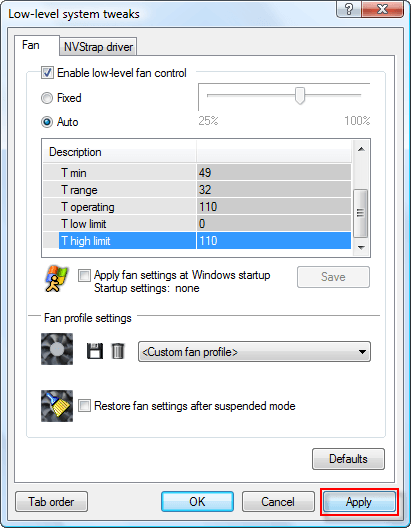
New values:
Duty cycle min: 60
Duty cycle max: 100
T min: 49
T range: 32
T operating: 110
T low limit: 0
T high limit: 110
You can tweak with this to determine what works best for you.
El Bastardo from the Guru3D Forums has provided a very easy to use Excel spreadsheet (original post). To use it, just edit the values in the orange boxes. If you don’t have a program to read .xls files, you can use OpenOffice, Excel Viewer, or many other free programs to view.
Now, use Hardware Monitoring to view the automatic fan speed in action. Make sure to delete any scheduler items that change on range events, just to avoid any conflicts.
To increase your GPU temperature, you can use a program called ATi Tool. Then, you just hit the “Show 3D view” button and watch the temperatures climb. The fan cycle should increase as the temperature increases.
This concludes the “Advanced Automatic Fan Speed” section of the tutorial.
Creating Overclocking Profiles
Besides controlling the fan speed under RivaTuner, one of the most asked questions is how to overclock. This process is simple and dangerous. I advise that you research more about overclocking and your video card’s potential before continuing.
No one is responsible, except you for the outcome to your video card(s).
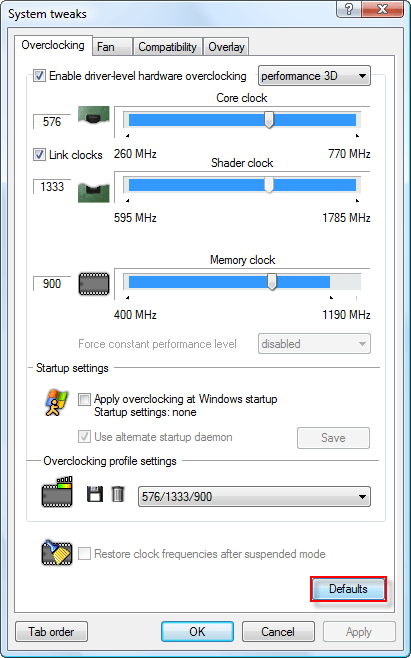
To begin, head to “System settings,” located under the Main RivaTuner window.
Then check the “Enable drive-level hardware overclocking” check box.
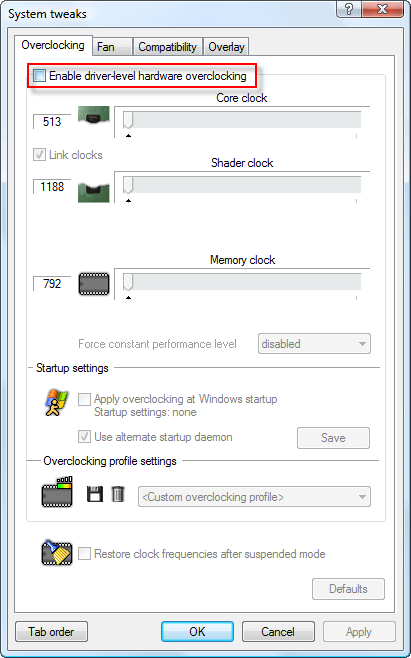
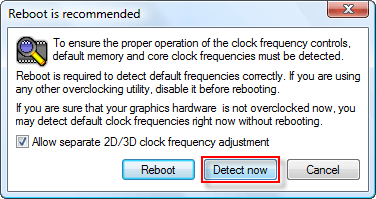
You may be prompted to reboot your computer to determine the clock speeds. Just click “Detect now.”
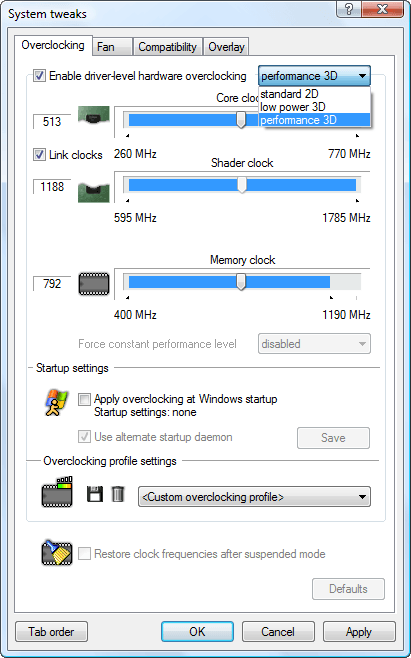
Make sure to select “performance 3D” under the drop down box in the top right.
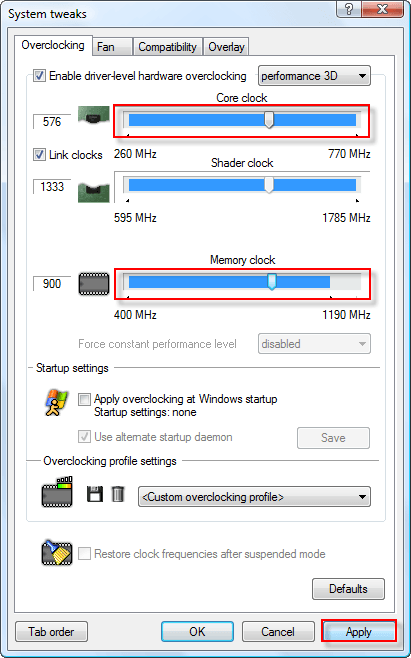
Drag the arrows across the bar to set your Core clock and your memory clock. A lot of the time manufacturers will release a general video card with standard clocks, if you purchased one of these, you can use the overclocked versions of those cards as a baseline for your graphics card potential.
I’ve set the 8800 GTS 640MB video card to 576/1800 which is the Superclocked version of my card. With the 8800 GTS 640MB card, I’ve overclocked the core clock well into the mid 600 range without artifacts or heat issues.
Once, you’ve set your core and memory clocks, click Apply.
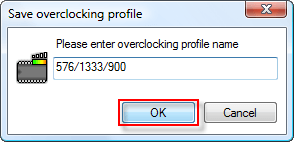
Then save the profile by clicking the “Save overclocking profile” button (disk icon).
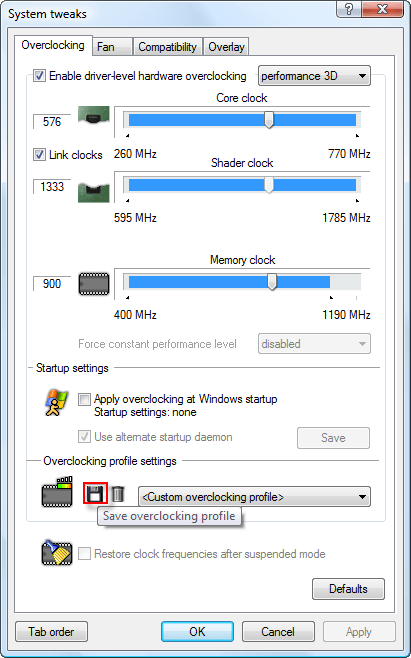
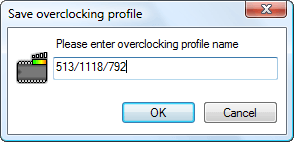
Name the profile usually by the clocks used.
You will want to verify your overclock after its done by running bench tests and looking for artifacts (distortions in the video).
Tools to use:
- ATI Tool
- Futuremark 3DMark06
- Futuremark 3DMark Vantage
Then usually create a overclock profile for your graphics cards default values.
Click the “Defaults” button.
Click Apply.
Then save the profile by the clock speeds once again.
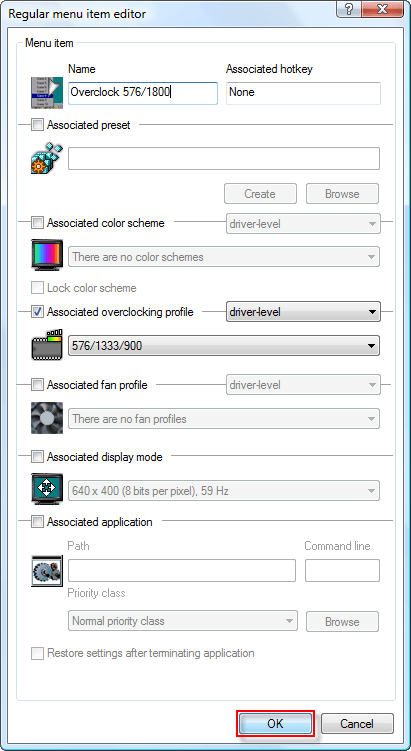
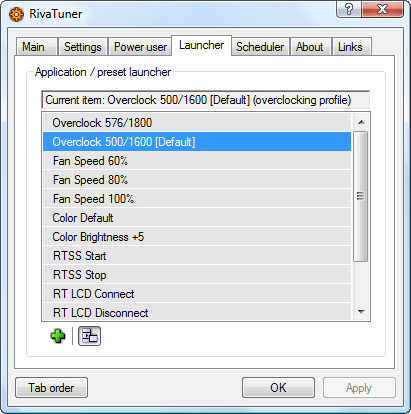
Now, you can launch these items through scheduled tasks or from the system tray by going to the Launcher tab under the RivaTuner main window and clicking the “Add new item” button (plus icon).
Type the name of the item, check the “***ociated overclocking profile” check box”, and select the overclock profile.
Click OK to finish.
You can repeat for the default overclock profile as well and when your done, it should look something like this:
That concludes the “Creating Overclock Profiles” section of the tutorial.
Adding Plugins
Plugins is one of the features most people never really get into with RivaTuner, but if you have a Core2Duo processor, this plugin is very handy.
Double click the downloaded file to extract the contents.
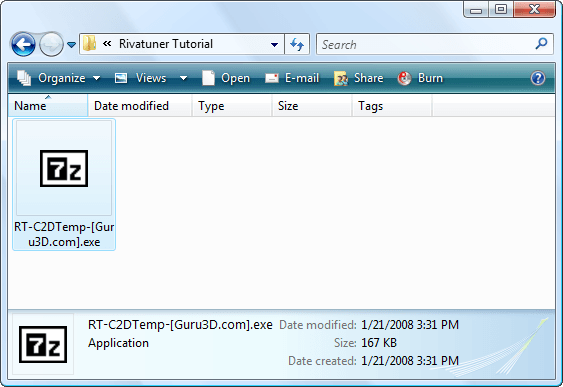
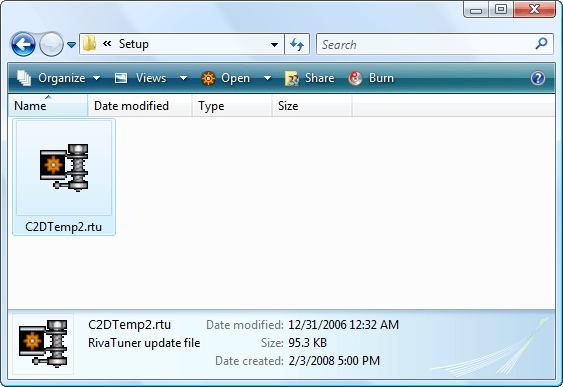
Navigate to the extracted folder and double-click on the “C2DTemp2.rtu” file.
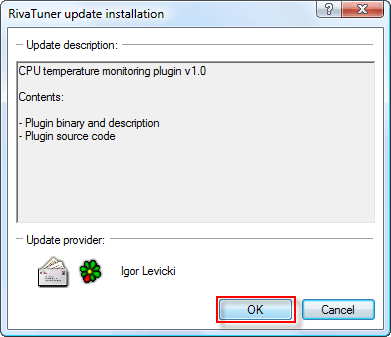
You will be prompted with an update installation window.
Click OK.
Click Yes, to restart RivaTuner. (During Alpha and Beta testing, a manual restart was needed)
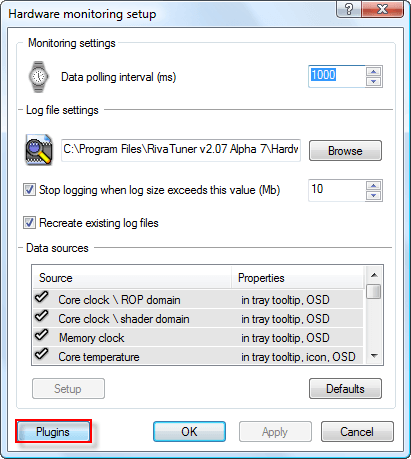
Once restarted, head to the Hardware Monitoring window and click “Setup”.
Then click “Plugins” on the bottom left of the window.
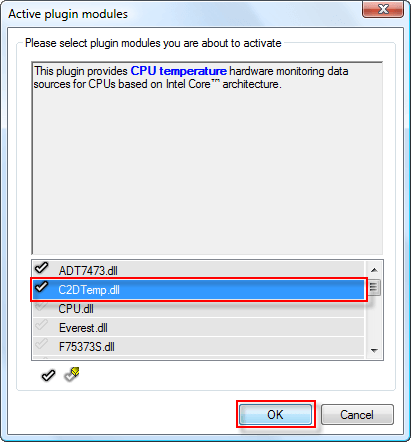
Browse down to the “C2DTemp.dll” file and click the check mark to the left of it, so it’s enabled.
Then click OK.
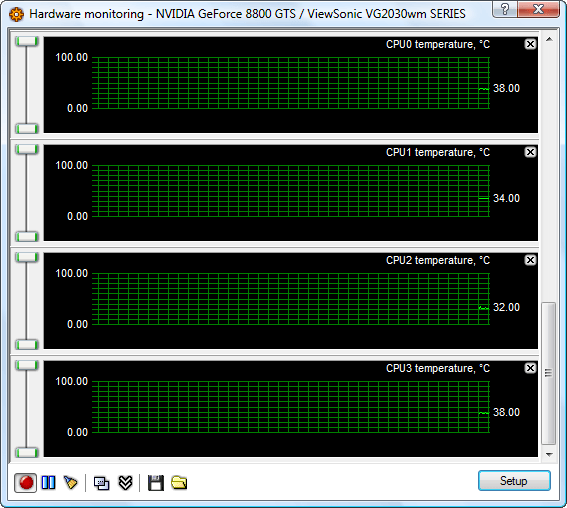
You will now have entries for each Core of your CPU. You can add system tray icons or display the information on your Logitech G15 gaming keyboard.
That’s it, you’ve finished the “Adding Plugins” section of this tutorial.
If you have any questions or suggestions, either send us a message or head over to our forums.
If you decide to link or copy this tutorial, please provide a link to Vaguetech or reference the author: Derek Wood.
.
.
.
Copyright (c) 2008 Derek Wood
Permission is granted to copy, distribute and/or modify this document under the terms of the GNU Free Documentation License, Version 1.2 or any later version published by the Free Software Foundation; with no Invariant Sections, no Front-Cover Texts, and no Back-Cover Texts.